Reference Centre
Return to the Antenna Application Notes
Overview
Antenna datasheets commonly include 2D radiation plots to show how RF energy is radiated in different directions at specific frequencies. This guide explains how to interpret XY, XZ and YZ cut planes, why 2D plots do not always show the strongest radiation point, and how 2D and 3D plots should be used together during antenna selection.
¶ Introduction
Radiation plots are graphical representations of how an antenna radiates or receives RF energy in space.
They help engineers and installers understand:
- antenna directivity
- radiation pattern shape
- strongest radiation directions
- weak radiation areas
- radiation nulls
- installation suitability
- expected antenna behaviour
Radiation plots are typically measured at specific frequencies because antenna behaviour changes across the operating band.
¶ Objectives
This guide explains:
- what 2D radiation plots show
- what 3D radiation plots show
- the difference between XY, XZ and YZ cut planes
- why 2D cuts may not show the maximum radiation point
- how to interpret radiation plots correctly
- how to use radiation plots during antenna selection
- which additional RF parameters should also be considered
Expected Result
At the end of this guide the user will understand how to interpret 2D and 3D radiation plots and use them correctly during antenna selection and deployment.
¶ What is a Radiation Plot?
A radiation plot shows how RF energy is radiated around an antenna.
Radiation plots are commonly presented as:
- 2D cut-plane plots
- 3D radiation plots
A 2D plot shows a slice through the full radiation pattern.
A 3D plot shows the overall radiation shape in space.
¶ Why Radiation Plots Matter
Radiation plots help determine whether an antenna is suitable for a specific application or installation environment.
They can help identify:
- omnidirectional behaviour
- directional behaviour
- strong radiation directions
- weak radiation directions
- vertical beam shape
- coverage suitability
- potential installation limitations
Important Note
Radiation plots should not be used in isolation. VSWR, return loss, efficiency, gain, cable loss and installation conditions should also be considered during antenna selection.
¶ 2D and 3D Radiation Plots
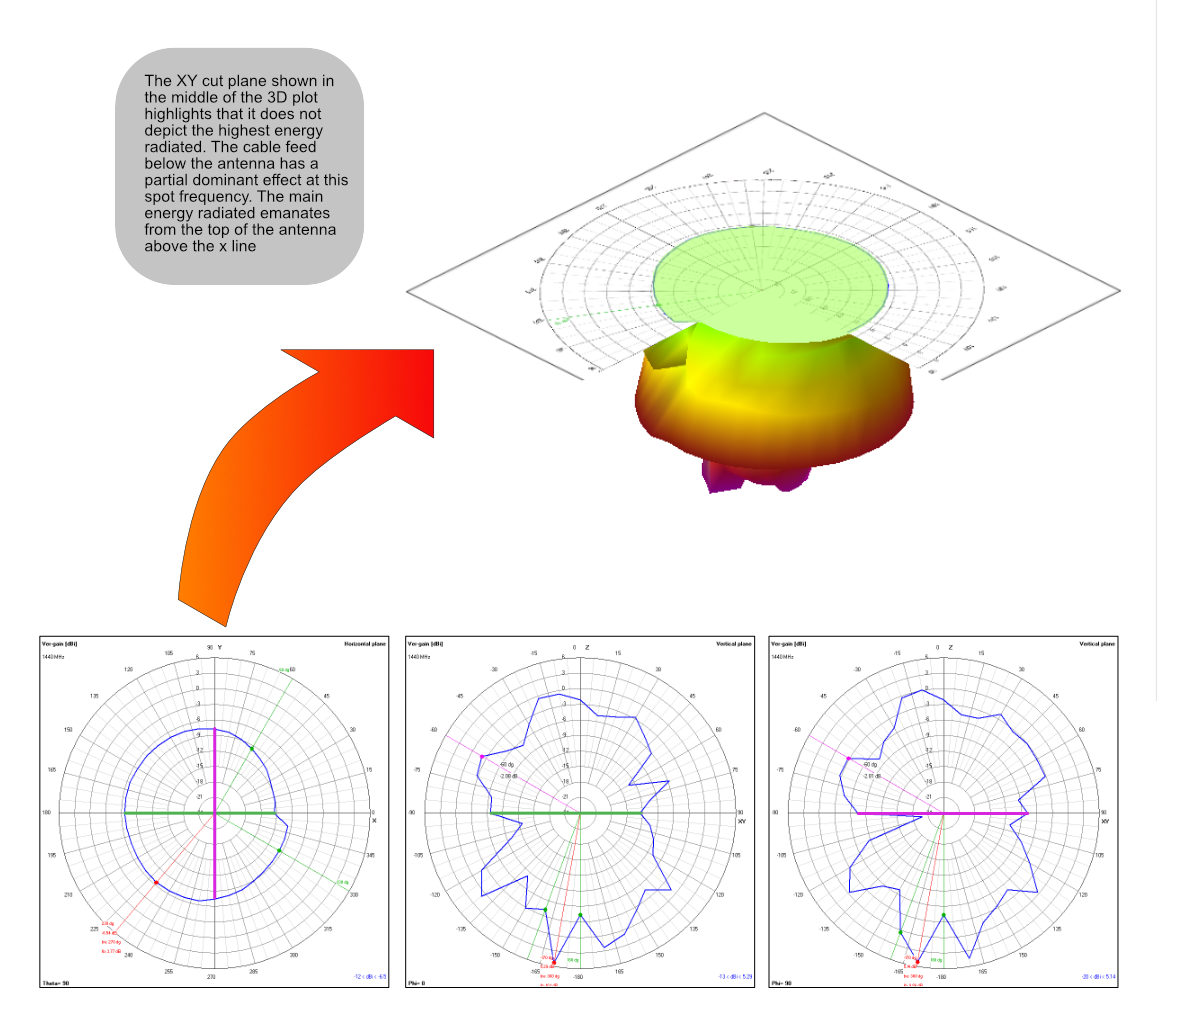
The image below shows the relationship between 2D and 3D radiation plot representations.
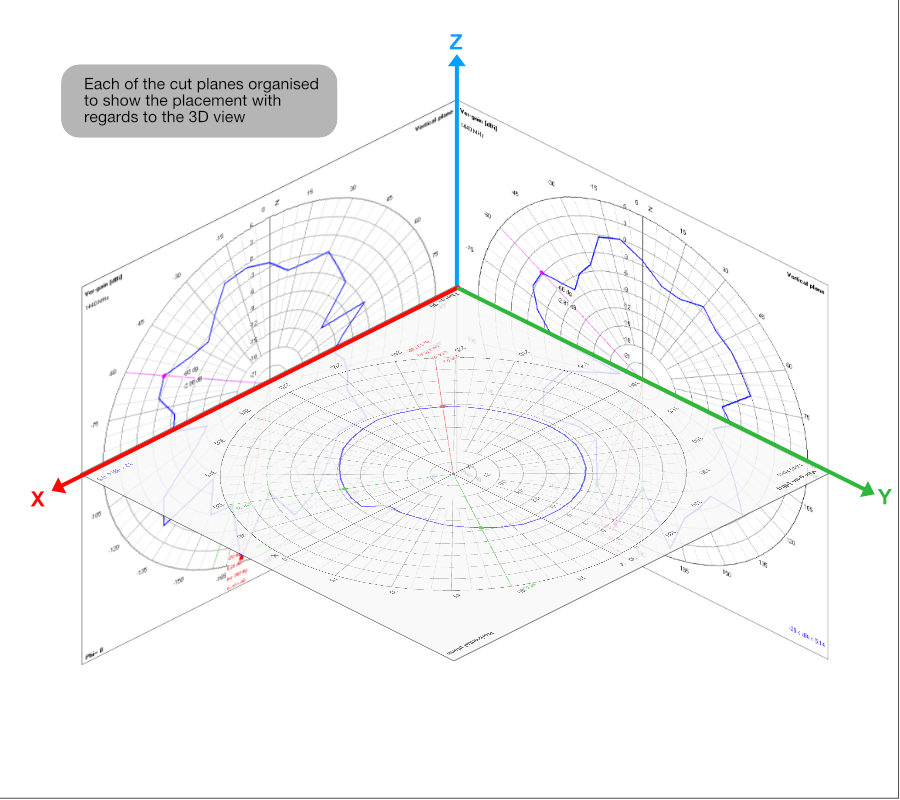
The 2D representation is a standard spherical data format commonly used by test laboratories and datasheets.
The 3D representation provides an easier visual overview of the complete radiation pattern.
¶ Standard 2D Radiation Plot Planes
Antenna datasheets commonly include three standard 2D cut planes.
| Plane | Description |
|---|---|
| XY | Horizontal radiation plane |
| XZ | Vertical radiation plane |
| YZ | Vertical radiation plane at right angles to XZ |
Each cut plane represents a slice through the full 3D radiation pattern.
¶ Understanding the XY Plane
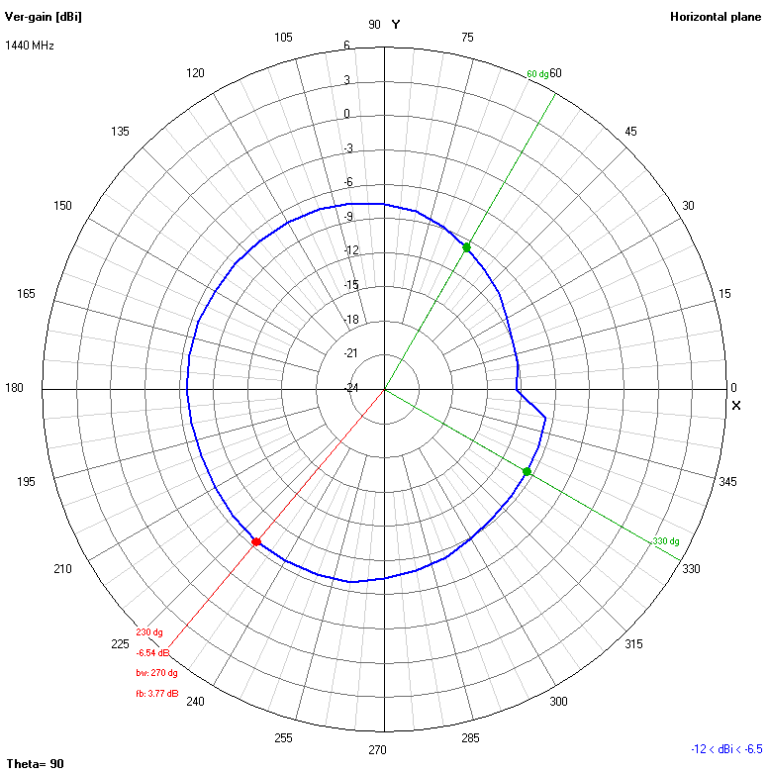
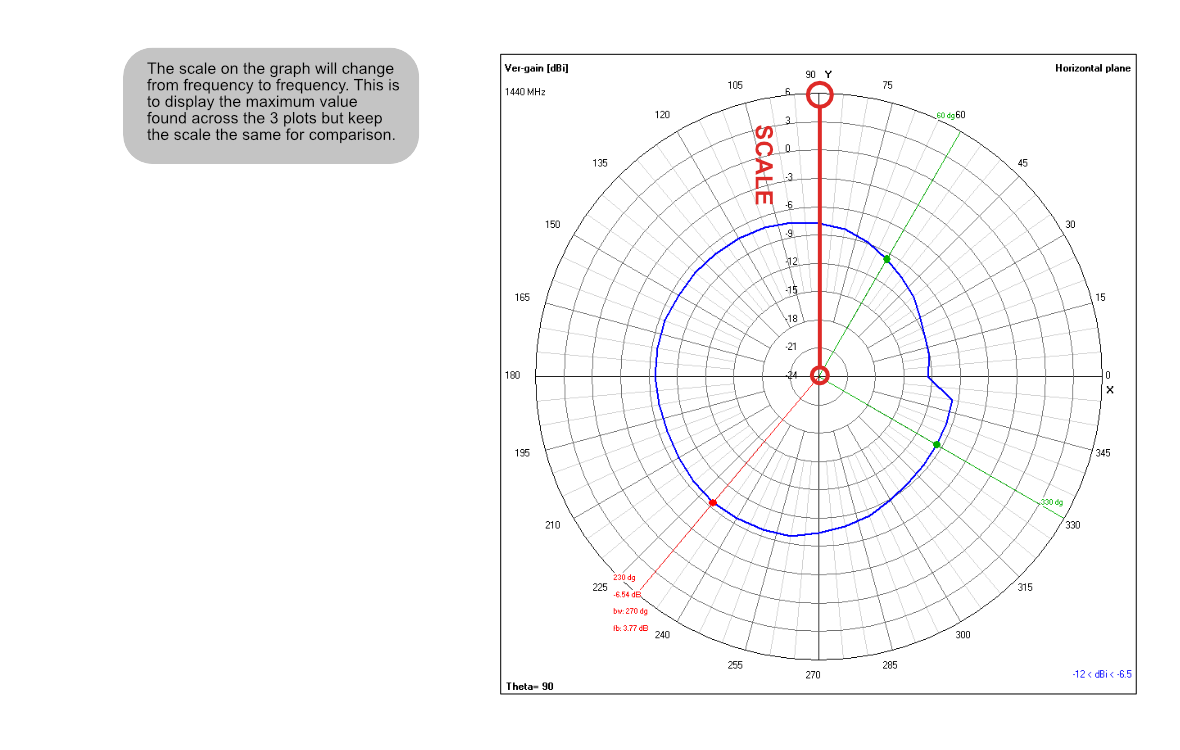
The XY plot is commonly treated as the horizontal radiation cut.
This view is useful for understanding:
- omnidirectional coverage
- horizontal radiation consistency
- vehicle antenna coverage
- router antenna behaviour
- general IoT coverage performance
The XY plot is often the first plot reviewed for omnidirectional antennas.
¶ Understanding the XZ and YZ Planes
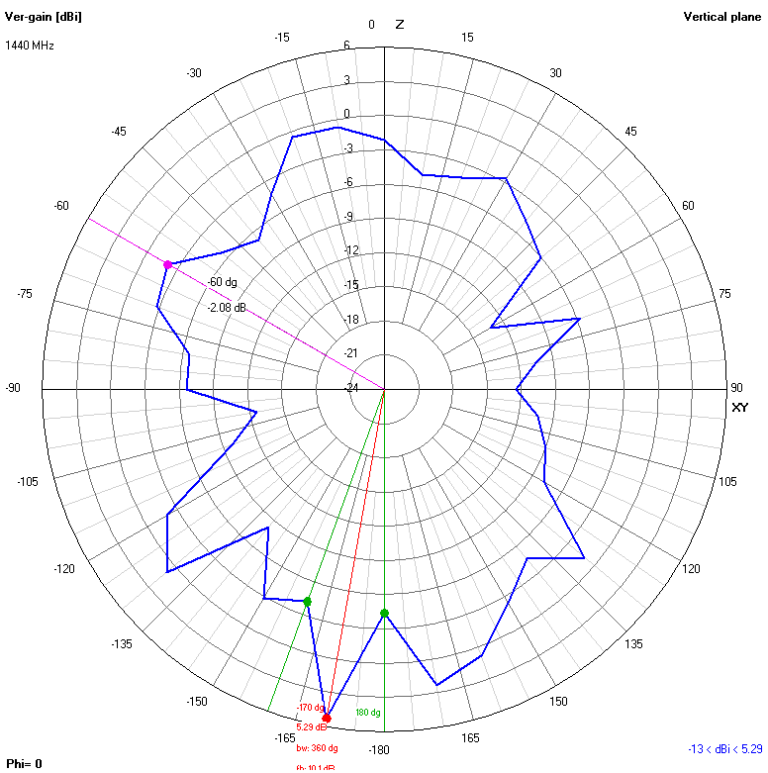
The XZ and YZ plots show vertical cuts through the antenna radiation pattern.
These plots help visualise:
- vertical beam shape
- upward radiation
- downward radiation
- antenna tilt behaviour
- vertical nulls
- mounting orientation effects
The vertical plots can be extremely important for practical installations.
¶ 1440 MHz Radiation Plot Example
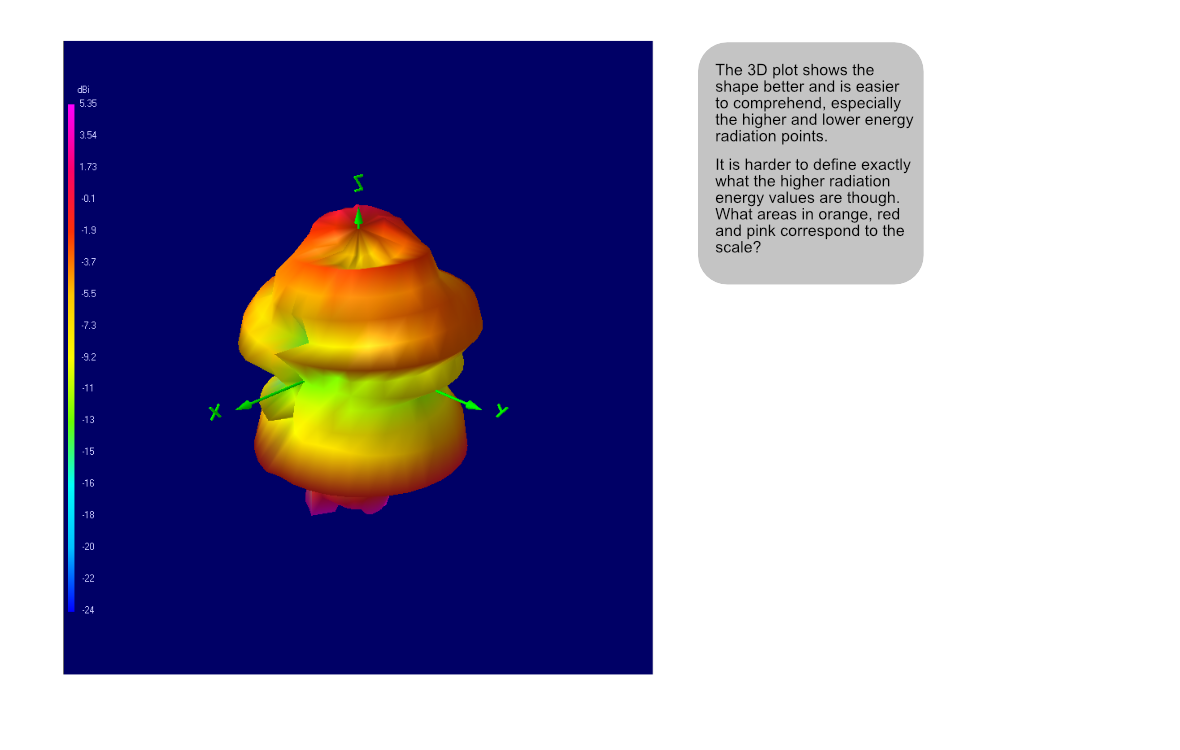
The following image shows a 3D radiation plot at 1440 MHz.
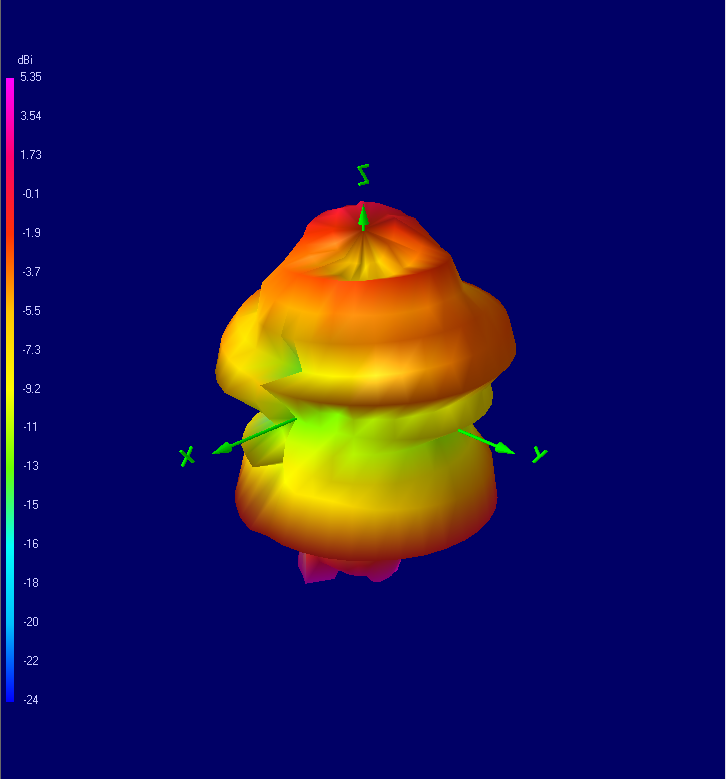
The 3D plot provides a visual overview of the overall radiation shape around the antenna.
This makes it easier to understand:
- where RF energy is concentrated
- the overall beam shape
- areas of reduced radiation
- directional characteristics
¶ 1440 MHz 2D Radiation Plot Examples
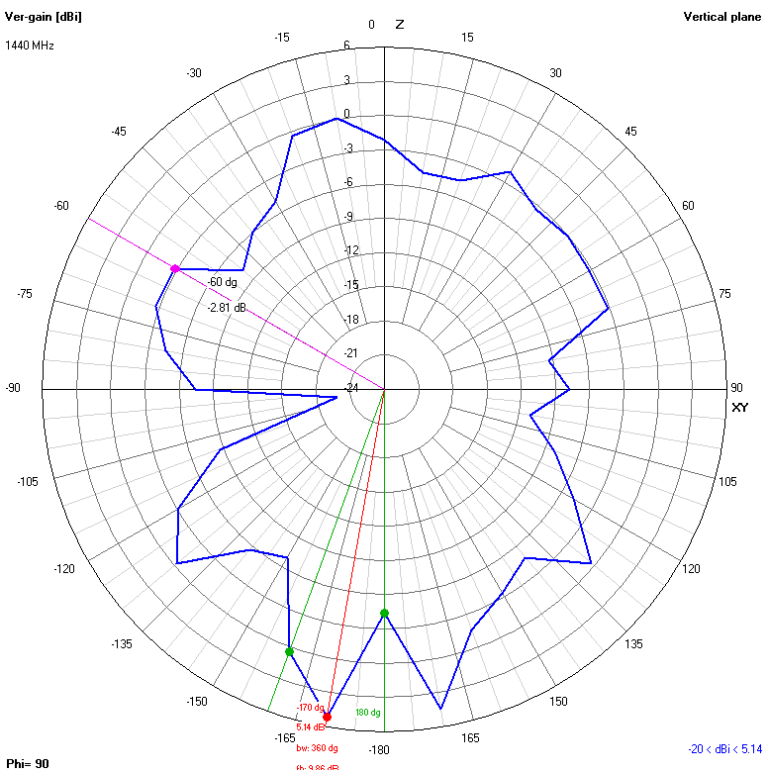
The following images show the standard XY, XZ and YZ cut planes at 1440 MHz.
|
XY Horizontal Radiation Plot
|
XZ Vertical Radiation Plot
|
YZ Vertical Radiation Plot
|
¶ Why the XY Plot Does Not Always Show Maximum Radiation
A common misunderstanding is that the XY plot always shows the strongest antenna radiation point.
This is not always true.
The maximum radiation point may:
- occur above or below the horizontal plane
- occur between the standard cut planes
- appear more strongly in the XZ or YZ cuts
- exist at an angle not directly shown by the standard plots
Important Note
A 2D radiation plot only shows one slice through the full 3D radiation pattern. The strongest radiation point may exist outside the displayed cut plane.
¶ Reading Radiation Levels from 2D Plots
2D plots are useful because they allow approximate radiation levels to be viewed at specific angular positions.
This makes them useful for:
- checking coverage at specific angles
- identifying weak directions
- comparing horizontal and vertical coverage
- comparing different antennas
- checking radiation symmetry
¶ Advantages of 2D Radiation Plots
| Advantage | Benefit |
|---|---|
| Precise angle reference | Allows approximate level comparison at defined directions |
| Standard format | Widely used in antenna datasheets |
| Easy cut-plane comparison | Useful for reviewing horizontal and vertical behaviour |
| Useful for null identification | Helps identify weak radiation directions |
¶ Limitations of 2D Radiation Plots
2D plots do not show the complete antenna radiation behaviour.
| Limitation | Explanation |
|---|---|
| Single-plane representation | Only one slice through the radiation pattern is shown |
| May miss maximum gain point | Strongest radiation may occur outside the displayed plane |
| May hide nulls | Weak directions may exist outside the selected cut |
| Requires multiple views | Several plots are normally needed for full understanding |
¶ Advantages of 3D Radiation Plots
3D plots provide a more intuitive visual representation of the antenna radiation shape.
| Advantage | Benefit |
|---|---|
| Complete visual overview | Shows the overall radiation shape |
| Easier visualisation | Helps understand antenna directionality |
| Highlights overall beam shape | Useful for directional analysis |
| Improves understanding of nulls | Weak radiation areas become easier to visualise |
¶ Limitations of 3D Radiation Plots
Although visually useful, 3D plots are less convenient for reading exact values.
| Limitation | Explanation |
|---|---|
| Less precise | Specific angular values are harder to read accurately |
| Visual interpretation required | Shape understanding is prioritised over precise values |
| Often requires supporting 2D plots | 2D cuts remain useful for detailed comparison |
¶ Additional Radiation Plot Examples
The following diagrams further illustrate radiation plot interpretation concepts.
¶ Frequency Dependency
Antenna radiation behaviour changes with frequency.
An antenna may perform differently across:
- LTE low bands
- LTE mid bands
- LTE high bands
- 5G frequencies
- GNSS frequencies
- WiFi bands
- ISM frequencies
Always review radiation plots at the operating frequencies relevant to the final application.
¶ Radiation Nulls
A null is a direction where the antenna radiates significantly less RF energy.
Nulls are important because they may create weak coverage directions.
Nulls may be caused by:
- antenna geometry
- ground plane behaviour
- enclosure effects
- cable routing
- nearby conductive materials
- installation orientation
Important Note
A strong average antenna specification does not guarantee strong radiation in every direction. Always check for radiation nulls in important installation directions.
¶ Installation Orientation Effects
The final installation orientation can significantly affect antenna behaviour.
Examples include:
- vertical vs horizontal mounting
- proximity to metal surfaces
- enclosure detuning
- nearby cable coupling
- ground plane interaction
The final installed performance may therefore differ from free-space laboratory measurements.
¶ Other Important RF Parameters
Radiation plots are only one part of antenna evaluation.
Other important parameters include:
| Parameter | Purpose |
|---|---|
| VSWR | Indicates impedance matching quality |
| Return Loss | Shows reflected RF energy |
| Efficiency | Indicates how effectively RF power is radiated |
| Peak Gain | Shows strongest radiation direction gain |
| Average Gain | Indicates overall antenna performance |
| Frequency Coverage | Confirms supported operating bands |
¶ VSWR and Return Loss
VSWR and return loss indicate how well the antenna is matched to the RF system.
Poor matching can result in:
- reduced transmitted power
- reduced receiver sensitivity
- reflected RF energy
- lower efficiency
Radiation plots should therefore always be considered alongside VSWR and return loss data.
¶ Radiation Efficiency
Radiation efficiency indicates how effectively the antenna converts RF input power into radiated energy.
Poor efficiency may result in:
- reduced communication range
- weaker received signals
- reduced throughput
- increased retransmissions
- higher power consumption
An antenna may show a useful radiation pattern but still have poor efficiency.
¶ Best Practice Recommendations
When reviewing antenna radiation plots:
- review both 2D and 3D plots
- compare XY, XZ and YZ cuts
- check the operating frequency
- review radiation nulls
- consider installation orientation
- check VSWR and return loss
- review antenna efficiency
- validate performance in the final enclosure where possible
¶ Common Interpretation Mistakes
| Mistake | Consequence |
|---|---|
| Only reviewing the XY plot | May miss important vertical behaviour or nulls |
| Assuming the XY plot shows maximum gain | Strongest radiation may exist outside the displayed plane |
| Ignoring 3D plots | Overall radiation behaviour may be misunderstood |
| Ignoring installation orientation | Installed behaviour may differ from laboratory measurements |
| Ignoring frequency dependency | Performance may vary across operating bands |
| Ignoring VSWR and efficiency | Radiation shape alone does not confirm antenna quality |
¶ Antenna Evaluation Workflow
| Step | Action |
|---|---|
| 1 | Identify the operating frequency band |
| 2 | Review the relevant radiation plots |
| 3 | Compare XY, XZ and YZ cut planes |
| 4 | Review the 3D radiation pattern |
| 5 | Check for radiation nulls |
| 6 | Review VSWR and efficiency |
| 7 | Consider installation orientation |
| 8 | Validate installed performance where possible |
¶ Key Takeaways
| Point | Explanation |
|---|---|
| 2D plots show cut-plane slices | Each plot represents only one slice through the full 3D radiation pattern |
| XY plots do not always show maximum radiation | The strongest point may exist outside the horizontal plane |
| 3D plots provide overall visualisation | They help visualise the complete radiation shape |
| Multiple plots should be reviewed together | Combining 2D and 3D plots gives a better understanding of antenna behaviour |
| Other RF parameters remain important | VSWR, return loss and efficiency should also be reviewed |
¶ Related Documents
- Successful Antenna Selection in Embedded IoT Applications
- Low Profile Antennas in IoT Applications
- GNSS Antenna Selection for Embedded Applications
- Improving Cellular Signal Reception in IoT Applications
¶ Process Summary
| Step | Purpose |
|---|---|
| Review 2D plots | Understand cut-plane behaviour |
| Review 3D plots | Understand overall radiation shape |
| Check operating frequency | Confirm application suitability |
| Review nulls | Identify weak radiation directions |
| Check VSWR and efficiency | Confirm broader antenna suitability |
| Validate installation | Confirm real-world performance |
Reference Centre
Return to the Antenna Application Notes
Support
For further assistance, please contact the Siretta support team.